We then propose the use of the general symmetry transform [3] [11] [13] [10]. This is an annular sampling region which detects edge configurations that enclose an object. Unlike template matching, a perceptual measure of symmetric enclosure is computed and blob centers are detected. When applied at the appropriate scale this transform consistently detects circular objects. The dark symmetry transform is a variation that restricts the wave propagation so that only dark radial symmetry is computed. In other words, the algorithm will generate a strong response from circular objects that are darker than the background.
Beginning with a phase and edge map of the image, we perform wave
propagation. The wave propagation integrates cocircular edge segments
in a computationally efficient way. For each point in the image p,
at each scale or radius r and for each symmetry orientation ![]() we find the set of cocircular pairs of edges
we find the set of cocircular pairs of edges ![]() .
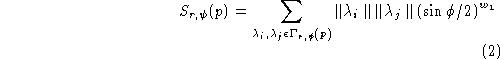
The magnitude of axial symmetry in the (p, r,
.
The magnitude of axial symmetry in the (p, r, ![]() ) space is as
follows:
) space is as
follows:
where ![]() and
and ![]() are the edge intensities of the two co-circular edges and
are the edge intensities of the two co-circular edges and
![]() is the angle separating their normals.
is the angle separating their normals.
Then, radial symmetry, I(p), is determined from the axial symmetry map as in
Equation ![]() and Equation
and Equation ![]() .
Finally, the symmetry map undergoes Gaussian smoothing and local
maxima are determined.
.
Finally, the symmetry map undergoes Gaussian smoothing and local
maxima are determined.
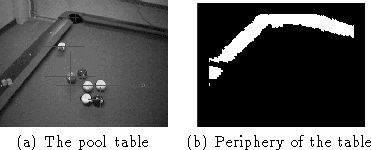
We apply the symmetry transform twice for each image. First, on the interior of the table, we apply the general symmetry transform to find both dark and bright balls. Then, on the periphery of the table, we apply dark symmetry to find the consistently darker pockets.
Figure ![]() shows a pool table and the periphery where
we might expect to find pockets (computed from the previous
stage). Figure
shows a pool table and the periphery where
we might expect to find pockets (computed from the previous
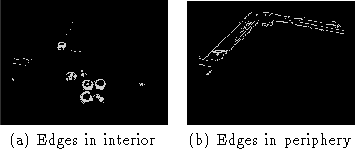
stage). Figure ![]() (a) displays the edge map of the interior of
the table and (b) displays the edge map of the periphery of the
table. Edge maps and phase maps (not shown) are computed using the
Sobel operator. The edges due to green portions of the table are
suppressed and the edge maps undergo some processing (non-maximal
suppression and thresholding).
(a) displays the edge map of the interior of
the table and (b) displays the edge map of the periphery of the
table. Edge maps and phase maps (not shown) are computed using the
Sobel operator. The edges due to green portions of the table are
suppressed and the edge maps undergo some processing (non-maximal
suppression and thresholding).
We then compute the symmetry transforms and obtain peaks of symmetry
which have been overlaid on the table image in
Figure ![]() . These peaks are triggered by balls and pockets
(mostly) but there are some weak false alarm triggers. So, we wish to
filter these candidate balls and pockets to reject false ones and also
to label them.
. These peaks are triggered by balls and pockets
(mostly) but there are some weak false alarm triggers. So, we wish to
filter these candidate balls and pockets to reject false ones and also
to label them.
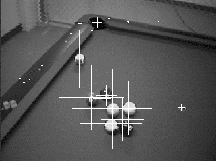
Figure: Ball and Pocket Candidates