Overview
This page lists current results on the PubFig benchmark. To add your results, send the following information to Neeraj Kumar:- ROC curves in a text file. See the raw data section for the format of this file.
- Average score, computed as the average accuracy (# correct pairs / # total pairs) using a fixed threshold (set beforehand) over all 10 folds of the cross-validation set
- Full citation for your paper
- Optionally: bibtex entry, pdf of paper (or link), webpage link
Raw Data
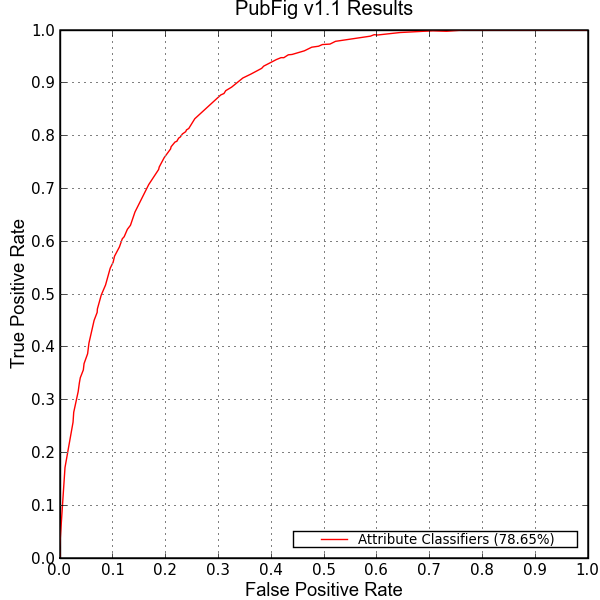
The raw datafile from which this graph was generated is here. The file contains a heading for each curve to plot, on a line like:# Attribute Classifiers (78.65%)where the # signifies that it's a comment, and the rest of the line is used as the label for the plot curve. Each subsequent line has one point of the curve, as true positive rate followed by false positive rate, separated by a space or tab. Each point should be the average true positive/false positive rate over all 10 folds of the relevant cross-validation set, for a particular threshold value.
The graph was generated using this python script. The script takes the raw datafile and output image name as arguments and generates the graph exactly as above. It's written in Python and requires matplotlib.
References
"Attribute and Simile Classifiers for Face Verification,"[bibtex] [pdf] [webpage]
Neeraj Kumar, Alexander C. Berg, Peter N. Belhumeur, and Shree K. Nayar,
International Conference on Computer Vision (ICCV), 2009.
@InProceedings{attribute_classifiers,
author = {N. Kumar and A. C. Berg and P. N. Belhumeur and S. K. Nayar},
title = {{A}ttribute and {S}imile {C}lassifiers for {F}ace {V}erification},
booktitle = {IEEE International Conference on Computer Vision (ICCV)},
month = {Oct},
year = {2009}
}