


Next: Robustness of Recognition:
Up: Results and Discussions
Previous: Measure for Recognition():
We test the
effectiveness of our technique for estimating
correspondences through the shift  .
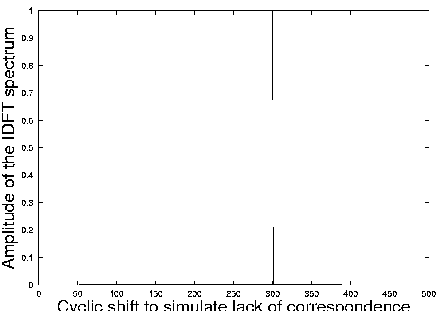
Figures 2 and 3 show the inverse Fourier spectrum of
the ratio
.
Figures 2 and 3 show the inverse Fourier spectrum of
the ratio
 , when
the shifts aligning corresponding points in the two affine
views are 150 and 300 respectively.
, when
the shifts aligning corresponding points in the two affine
views are 150 and 300 respectively.
Figure:
Graph showing the amplitude of the IDFT of
 against the shift for an affine homography when the synthetic shift is 150.
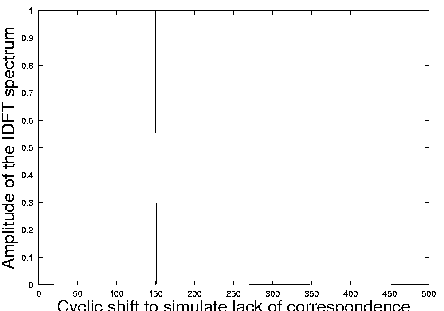 |
Figure:
Graph showing the amplitude of the IDFT of
against the shift for an affine homography when the synthetic shift is 300.
 |
2002-10-09