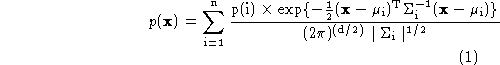
Figure: The color training samples
Figure: Fitting a Gaussian Mixture
To find the pool table, we train a probabilistic color model of the
green felt that covers it [18] [9]. This is done
by taking multiple training samples of several images of a pool table
under many imaging situations (offline). Each pixel in this
distribution forms a 3 element vector, [R G B] which corresponds to
the red, green and blue components of the color. We perform clustering
on this distribution of pixels which is shown in
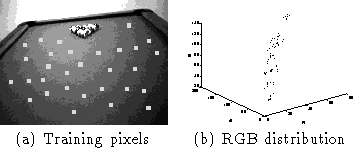
Figure ![]() . The clustering uses Expectation
Maximization (EM) to find a probability distribution model for pool
table colors [5] [19]. This model is a mixture of
Gaussians (the appropriate number of Gaussians is determined a priori
with cross-validation). The EM algorithm iterates by adjusting the
parameters of the Gaussian probability model to maximize the
likelihood of the training samples. The probability distribution model
starts off in a random configuration and converges to the configuration
in Figure
. The clustering uses Expectation
Maximization (EM) to find a probability distribution model for pool
table colors [5] [19]. This model is a mixture of
Gaussians (the appropriate number of Gaussians is determined a priori
with cross-validation). The EM algorithm iterates by adjusting the
parameters of the Gaussian probability model to maximize the
likelihood of the training samples. The probability distribution model
starts off in a random configuration and converges to the configuration
in Figure ![]() . The mixture model is described by
Equation
. The mixture model is described by
Equation ![]() where
where ![]() is an (R,G,B)
vector.
is an (R,G,B)
vector.
When a new image is acquired, the likelihood of each pixel is
evaluated using this model and if it is above a threshold of
probability, it is labeled as a piece of the pool table. Then, a
connected component analysis is used to gather adjacent green pixels
to determine larger regions of grouped table pixels in the image. This
process is demonstrated in Figure ![]() . The largest
connected region of green pixels is selected as the table top and
proceeds through the algorithm for further processing.
. The largest
connected region of green pixels is selected as the table top and
proceeds through the algorithm for further processing.
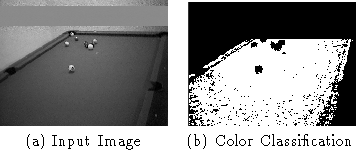
Figure: Pool Table Localization