During runtime, we need to quickly generate an output ![]() given
the input
given
the input ![]() .
Observing an
.
Observing an
![]() value turns our
conditional model
value turns our
conditional model
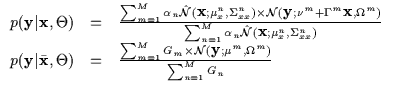
![]() into effectively a marginal
density over
into effectively a marginal
density over ![]() (i.e.
(i.e.
![]() ). The observed
). The observed
![]() makes the gates act merely as constants, Gm, instead of as
Gaussian functions. In addition, the conditional Gaussians which were
original experts become ordinary Gaussians when we observe
makes the gates act merely as constants, Gm, instead of as
Gaussian functions. In addition, the conditional Gaussians which were
original experts become ordinary Gaussians when we observe ![]() and the regressor term
and the regressor term
![]() becomes a simple
mean
becomes a simple
mean ![]() .
If we had a conditioned mixture of M Gaussians, the
marginal density that results is an ordinary sum of M Gaussians in
the space of
.
If we had a conditioned mixture of M Gaussians, the
marginal density that results is an ordinary sum of M Gaussians in
the space of ![]() as in Equation 7.33.
as in Equation 7.33.
Observe the 1D distribution in Figure 7.12. At this
point, we would like to choose a single candidate
![]() from this distribution. There are many possible strategies for
performing this selection with varying efficiencies and
advantages. We consider and compare the following three
approaches. One may select a random sample from
from this distribution. There are many possible strategies for
performing this selection with varying efficiencies and
advantages. We consider and compare the following three
approaches. One may select a random sample from
![]() ,
one may
select the average
,
one may
select the average ![]() or one may compute the
or one may compute the ![]() with the
highest probability.
with the
highest probability.
Sampling will often return a value which has a high probability
however, it may sometimes return low values due to its inherent
randomness. The average, i.e. the expectation, is a more consistent
estimate but if the density is multimodal with more than one
significant peak, the ![]() value returned might actually have low
value returned might actually have low
![]() [5] 7.2 (as is the case in
Figure 7.12). Thus, if we consistently wish to have a
response
[5] 7.2 (as is the case in
Figure 7.12). Thus, if we consistently wish to have a
response
![]() with high probability, the best candidate is
the highest peak in the marginal density, i.e. the arg max.
with high probability, the best candidate is
the highest peak in the marginal density, i.e. the arg max.
![\begin{figure}% latex2html id marker 5435
\center
\begin{tabular}[b]{c}
\epsfx...
...types]
{Output Probability Distribution, Expectation and Prototypes}\end{figure}](img248.gif)