Figure 2.2 (a): Attachment Analysis: Non-Spam
This module classifies email messages on the basis of their 'Content-Type'. The purpose of the Content-Type field is to describe the data contained in the body and to specify its nature.
The content type in the email messages is one of the following categories:
In MIME, the standard Internet e-mail format, messages and their attachments are sent as a multipart message.
The design of this module is object oriented and follows a class structure with methods and variables.
The AttachmentAnalyze() class is the main class which extends Module() class.
Implementation
This module is implemented in Java and is called AttachmentAnalyze.java
The main program MailStats.java passes two javax.mail.Message arrays containing the spam and non-spam respectively to this module.
The content-type of the non-spam message is retrieved using getHeader("Content-Type") method.
The content type is then parsed and classified into one of the following:
Where others are those mails in which content type is not specified.
Number of non-spam messages for each of the above categories is calculated. Similarly, number of spam messages for each of the above categories is calculated.
Results and Observations
Following are the results obtained when non-spam and spam messages were classified on the basis of the content type.
Following table (2.2 (a)) shows the distribution of non-spam messages on the basis of the content-type for all mailboxes:
| MailBox # | # of Messages | A: # of Non-Spam mails | B: multipart / alternative | (%) B/A*100 |
C: multipart / MIXED | (%) C/A*100 |
D: multipart / REPORT | (%) D/A*100 |
E: text / HTML | (%) E/A*100 |
F: text / PLAIN | (%) F/A*100 |
G: Other | (%) G/A*100 |
| 1 | 1818 | 1818 | 267 | 14.69 | 242 | 13.31 | 11 | 0.61 | 56 | 3.08 | 1207 | 66.39 | 35 | 1.93 |
| 2 | 593 | 497 | 340 | 68.41 | 102 | 20.52 | 0 | 0.00 | 19 | 3.82 | 30 | 6.04 | 6 | 1.21 |
| 3 | 1174 | 1174 | 182 | 15.50 | 213 | 18.14 | 4 | 0.34 | 1 | 0.09 | 732 | 62.35 | 42 | 3.58 |
| 4 | 641 | 576 | 197 | 34.20 | 215 | 37.33 | 0 | 0.00 | 13 | 2.26 | 148 | 25.69 | 3 | 0.52 |
| 5 | 5105 | 5002 | 1452 | 29.03 | 847 | 16.93 | 73 | 1.46 | 810 | 16.19 | 1690 | 33.79 | 130 | 2.60 |
| 6 | 1682 | 1418 | 358 | 25.25 | 158 | 11.14 | 1 | 0.07 | 399 | 28.14 | 492 | 34.70 | 10 | 0.71 |
| 7 | 1230 | 1230 | 142 | 11.54 | 80 | 6.50 | 1 | 0.08 | 372 | 30.24 | 623 | 50.65 | 12 | 0.98 |
| 8 | 1992 | 1788 | 1262 | 70.58 | 282 | 15.77 | 1 | 0.06 | 58 | 3.24 | 160 | 8.95 | 25 | 1.40 |
| 9 | 360 | 133 | 55 | 41.35 | 54 | 40.60 | 0 | 0.00 | 5 | 3.76 | 17 | 12.78 | 2 | 1.50 |
| 10 | 879 | 524 | 224 | 42.75 | 9 | 1.72 | 0 | 0.00 | 103 | 19.66 | 172 | 32.82 | 16 | 3.05 |
| 11 | 168 | 168 | 42 | 25.00 | 20 | 11.90 | 0 | 0.00 | 51 | 30.36 | 51 | 30.36 | 4 | 2.38 |
| 12 | 1322 | 1301 | 220 | 16.91 | 144 | 11.07 | 2 | 0.15 | 16 | 1.23 | 893 | 68.64 | 26 | 2.00 |
| 13 | 1408 | 1360 | 340 | 25.00 | 231 | 16.99 | 1 | 0.07 | 25 | 1.84 | 720 | 52.94 | 43 | 3.16 |
| 14 | 934 | 934 | 160 | 17.13 | 137 | 14.67 | 0 | 0.00 | 34 | 3.64 | 582 | 62.31 | 21 | 2.25 |
| 15 | 459 | 414 | 142 | 34.30 | 51 | 12.32 | 0 | 0.00 | 25 | 6.04 | 185 | 44.69 | 11 | 2.66 |
| 16 | 2183 | 1999 | 720 | 36.02 | 384 | 19.21 | 13 | 0.65 | 80 | 4.00 | 716 | 35.82 | 86 | 4.30 |
| 17 | 527 | 527 | 144 | 27.32 | 90 | 17.08 | 0 | 0.00 | 53 | 10.06 | 210 | 39.85 | 30 | 5.69 |
| 18 | 380 | 380 | 196 | 51.58 | 95 | 25.00 | 0 | 0.00 | 2 | 0.53 | 84 | 22.11 | 3 | 0.79 |
| 19 | 749 | 749 | 235 | 31.38 | 149 | 19.89 | 0 | 0.00 | 54 | 7.21 | 271 | 36.18 | 40 | 5.34 |
| 20 | 140 | 140 | 40 | 28.57 | 24 | 17.14 | 0 | 0.00 | 3 | 2.14 | 56 | 40.00 | 17 | 12.14 |
| 21 | 1522 | 1151 | 301 | 26.15 | 98 | 8.51 | 2 | 0.17 | 52 | 4.52 | 690 | 59.95 | 8 | 0.70 |
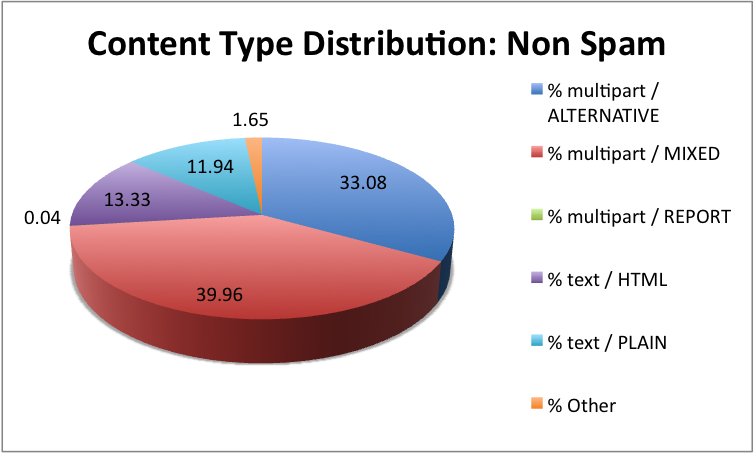
| 22 | 3316 | 2370 | 784 | 33.08 | 947 | 39.96 | 1 | 0.04 | 316 | 13.33 | 283 | 11.94 | 39 | 1.65 |
| Total | 28582 | 25653 | 7803 | 30.42 | 4572 | 17.82 | 110 | 0.43 | 2547 | 9.93 | 10012 | 39.03 | 609 | 2.37 |
Following chart represents the distribution of all the non-spam messages on the basis of their content type. It is observed that 73.08 % of the non-spam messages are multipart messages (having attachments).
Following table (2.2 (b)) shows the distribution of spam messages on the basis of the content-type for all mailboxes:
| MailBox # | # of Messages | A: # of Spam mails | B: multipart / alternative | B/A*100 | C: multipart / MIXED | C/A*100 | D: multipart / REPORT | D/A*100 | E: text / HTML | E/A*100 | F: text / PLAIN | F/A*100 | G: Other | G/A*100 | |
| 1 | 1818 | 0 | 0 | N/A | 0 | N/A | 0 | N/A | 0 | N/A | 0 | N/A | 0 | N/A | |
| 2 | 593 | 96 | 24 | 25 | 0 | 0 | 0 | 0 | 17 | 17.71 | 55 | 57.29 | 0 | 0 | |
| 3 | 1174 | 0 | 0 | N/A | 0 | N/A | 0 | N/A | 0 | N/A | 0 | N/A | 0 | N/A | |
| 4 | 641 | 65 | 19 | 29.23 | 0 | 0 | 0 | 0 | 6 | 9.23 | 39 | 60 | 1 | 1.54 | |
| 5 | 5105 | 103 | 40 | 38.83 | 1 | 0.97 | 0 | 0 | 36 | 34.95 | 24 | 23.30 | 2 | 1.94 | |
| 6 | 1682 | 264 | 128 | 48.48 | 2 | 0.76 | 0 | 0 | 69 | 26.14 | 53 | 20.08 | 12 | 4.55 | |
| 7 | 1230 | 0 | 0 | N/A | 0 | N/A | 0 | N/A | 0 | N/A | 0 | N/A | 0 | N/A | |
| 8 | 1992 | 204 | 101 | 49.51 | 2 | 0.98 | 1 | 0.49 | 35 | 17.16 | 64 | 31.37 | 1 | 0.49 | |
| 9 | 360 | 227 | 142 | 62.56 | 0 | 0 | 0 | 0 | 6 | 2.64 | 79 | 34.80 | 0 | 0 | |
| 10 | 879 | 355 | 147 | 41.41 | 0 | 0 | 0 | 0 | 55 | 15.49 | 153 | 43.10 | 0 | 0 | |
| 11 | 168 | 0 | 0 | N/A | 0 | N/A | 0 | N/A | 0 | N/A | 0 | N/A | 0 | N/A | |
| 12 | 1322 | 21 | 0 | 0 | 1 | 4.76 | 0 | 0 | 0 | 0 | 20 | 95.24 | 0 | 0 | |
| 13 | 1408 | 48 | 33 | 68.75 | 0 | 0 | 1 | 2.08 | 7 | 14.58 | 6 | 12.5 | 1 | 2.08 | |
| 14 | 934 | 0 | 0 | N/A | 0 | N/A | 0 | N/A | 0 | N/A | 0 | N/A | 0 | N/A | |
| 15 | 459 | 45 | 8 | 17.78 | 0 | 0 | 0 | 0 | 11 | 24.44 | 26 | 57.78 | 0 | 0 | |
| 16 | 2183 | 184 | 82 | 44.57 | 1 | 0.54 | 0 | 0 | 93 | 50.54 | 8 | 4.35 | 0 | 0 | |
| 17 | 527 | 0 | 0 | N/A | 0 | N/A | 0 | N/A | 0 | N/A | 0 | N/A | 0 | N/A | |
| 18 | 380 | 0 | 0 | N/A | 0 | N/A | 0 | N/A | 0 | N/A | 0 | N/A | 0 | N/A | |
| 19 | 749 | 0 | 0 | N/A | 0 | N/A | 0 | N/A | 0 | N/A | 0 | N/A | 0 | N/A | |
| 20 | 140 | 0 | 0 | N/A | 0 | N/A | 0 | N/A | 0 | N/A | 0 | N/A | 0 | N/A | |
| 21 | 1522 | 371 | 166 | 44.74 | 1 | 0.27 | 0 | 0 | 121 | 32.61 | 83 | 22.37 | 0 | 0 | |
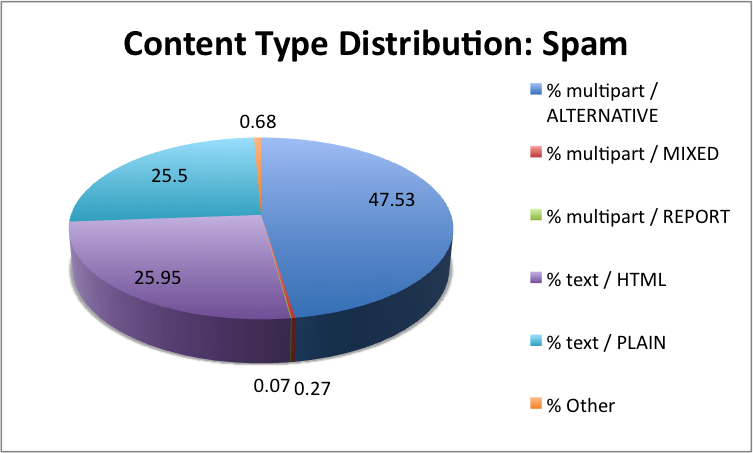
| 22 | 3316 | 946 | 502 | 53.07 | 0 | 0 | 0 | 0 | 304 | 32.14 | 137 | 14.48 | 3 | 0.32 | |
| Total | 28582 | 2929 | 1392 | 47.52 | 8 | 0.27 | 2 | 0.07 | 760 | 25.95 | 747 | 25.50 | 20 | 0.68 |
Following chart represents the distribution of all the spam messages on the basis of their content type. It is observed that 47.87 % of the spam messages are multipart messages (having attachments).
The table below contains the measures of multipart messages:
| MailBox # | # of Mails | A1: # of Mails with multipart /ALTERNATIVE | B1: # of Non-Spam with multipart / ALTERNATIVE | B1/A1 | A2: # of Mails with multipart / MIXED | B2: # of Non-Spam with multipart / MIXED | B2/A2 | A3: # of Mails with multipart / REPORT | B3: # of Non-Spam with multipart / REPORT | B3/A3 |
| 1 | 1818 | 267.00 | 267 | 1.00 | 242 | 242 | 1.00 | 11 | 11 | 1.00 |
| 2 | 593 | 364.00 | 340 | 0.93 | 102 | 102 | 1.00 | 0 | 0 | N/A |
| 3 | 1174 | 182.00 | 182 | 1.00 | 213 | 213 | 1.00 | 4 | 4 | 1.00 |
| 4 | 641 | 216.00 | 197 | 0.91 | 215 | 215 | 1.00 | 0 | 0 | N/A |
| 5 | 5105 | 1492.00 | 1452 | 0.97 | 848 | 847 | 1.00 | 73 | 73 | 1.00 |
| 6 | 1682 | 486.00 | 358 | 0.74 | 160 | 158 | 0.99 | 1 | 1 | 1.00 |
| 7 | 1230 | 142.00 | 142 | 1.00 | 80 | 80 | 1.00 | 1 | 1 | 1.00 |
| 8 | 1992 | 1363.00 | 1262 | 0.93 | 284 | 282 | 0.99 | 2 | 1 | 0.50 |
| 9 | 360 | 197.00 | 55 | 0.28 | 54 | 54 | 1.00 | 0 | 0 | N/A |
| 10 | 879 | 371.00 | 224 | 0.60 | 9 | 9 | 1.00 | 0 | 0 | N/A |
| 11 | 168 | 42.00 | 42 | 1.00 | 20 | 20 | 1.00 | 0 | 0 | N/A |
| 12 | 1322 | 220.00 | 220 | 1.00 | 145 | 144 | 0.99 | 2 | 2 | 1.00 |
| 13 | 1408 | 373.00 | 340 | 0.91 | 231 | 231 | 1.00 | 2 | 1 | 0.50 |
| 14 | 934 | 160.00 | 160 | 1.00 | 137 | 137 | 1.00 | 0 | 0 | N/A |
| 15 | 459 | 150.00 | 142 | 0.95 | 51 | 51 | 1.00 | 0 | 0 | N/A |
| 16 | 2183 | 802.00 | 720 | 0.90 | 385 | 384 | 1.00 | 13 | 13 | 1.00 |
| 17 | 527 | 144.00 | 144 | 1.00 | 90 | 90 | 1.00 | 0 | 0 | N/A |
| 18 | 380 | 196.00 | 196 | 1.00 | 95 | 95 | 1.00 | 0 | 0 | N/A |
| 19 | 749 | 235.00 | 235 | 1.00 | 149 | 149 | 1.00 | 0 | 0 | N/A |
| 20 | 140 | 40.00 | 40 | 1.00 | 24 | 24 | 1.00 | 0 | 0 | N/A |
| 21 | 1522 | 467.00 | 301 | 0.64 | 99 | 98 | 0.99 | 2 | 2 | 1.00 |
| 22 | 3316 | 1286.00 | 784 | 0.61 | 947 | 947 | 1.00 | 1 | 1 | 1.00 |
| Total | 28582 | 9195 | 7803 | 0.85 | 4580 | 4572 | 1.00 | 112 | 110 | 0.98 |
The table below contains the measures of messages without attachments:
| MailBox # | # of Mails | A4: # of Mails with text/HTML | B4: # of Non-Spam with text/HTML | B4/A4 | A5: # of Mails with text/ PLAIN | B5: # of Non-Spam with text/ PLAIN | B5/A5 | A6: # of Other Mails | B6: # of Other Non-Spam | B6/A6 |
| 1 | 1818 | 56 | 56 | 1.00 | 1207 | 1207 | 1.00 | 35 | 35 | 1.00 |
| 2 | 593 | 36 | 19 | 0.53 | 85 | 30 | 0.35 | 6 | 6 | 1.00 |
| 3 | 1174 | 1 | 1 | 1.00 | 732 | 732 | 1.00 | 42 | 42 | 1.00 |
| 4 | 641 | 19 | 13 | 0.68 | 187 | 148 | 0.79 | 4 | 3 | 0.75 |
| 5 | 5105 | 846 | 810 | 0.96 | 1714 | 1690 | 0.99 | 132 | 130 | 0.98 |
| 6 | 1682 | 468 | 399 | 0.85 | 545 | 492 | 0.90 | 22 | 10 | 0.45 |
| 7 | 1230 | 372 | 372 | 1.00 | 623 | 623 | 1.00 | 12 | 12 | 1.00 |
| 8 | 1992 | 93 | 58 | 0.62 | 224 | 160 | 0.71 | 26 | 25 | 0.96 |
| 9 | 360 | 11 | 5 | 0.45 | 96 | 17 | 0.18 | 2 | 2 | 1.00 |
| 10 | 879 | 158 | 103 | 0.65 | 325 | 172 | 0.53 | 16 | 16 | 1.00 |
| 11 | 168 | 51 | 51 | 1.00 | 51 | 51 | 1.00 | 4 | 4 | 1.00 |
| 12 | 1322 | 16 | 16 | 1.00 | 913 | 893 | 0.98 | 26 | 26 | 1.00 |
| 13 | 1408 | 32 | 25 | 0.78 | 726 | 720 | 0.99 | 44 | 43 | 0.98 |
| 14 | 934 | 34 | 34 | 1.00 | 582 | 582 | 1.00 | 21 | 21 | 1.00 |
| 15 | 459 | 36 | 25 | 0.69 | 211 | 185 | 0.88 | 11 | 11 | 1.00 |
| 16 | 2183 | 173 | 80 | 0.46 | 724 | 716 | 0.99 | 86 | 86 | 1.00 |
| 17 | 527 | 53 | 53 | 1.00 | 210 | 210 | 1.00 | 30 | 30 | 1.00 |
| 18 | 380 | 2 | 2 | 1.00 | 84 | 84 | 1.00 | 3 | 3 | 1.00 |
| 19 | 749 | 54 | 54 | 1.00 | 271 | 271 | 1.00 | 40 | 40 | 1.00 |
| 20 | 140 | 3 | 3 | 1.00 | 56 | 56 | 1.00 | 17 | 17 | 1.00 |
| 21 | 1522 | 173 | 52 | 0.30 | 773 | 690 | 0.89 | 8 | 8 | 1.00 |
| 22 | 3316 | 620 | 316 | 0.51 | 420 | 283 | 0.67 | 42 | 39 | 0.93 |
| Total | 28582 | 3307 | 2547 | 0.77 | 10759 | 10012 | 0.93 | 629 | 609 | 0.97 |
From the results obtained, it is observed that most of the messages that are of type multipart/MIXED and multipart/REPORT are exclusively non-spam.
Thus, they are good metrics to identify non-spam messages.
Next: Conclusion
Last updated: 2008-08-19 by Nirav Shah