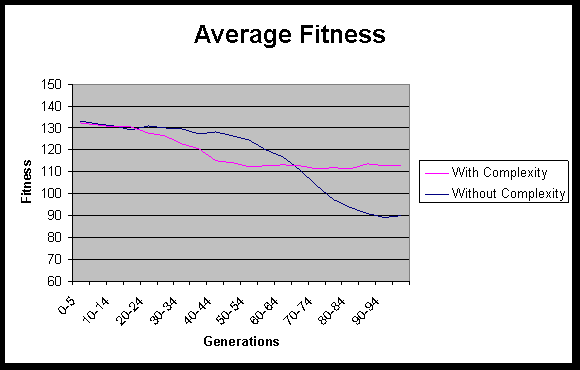
Average Fitness (with complexity vs. without complexity)
This graph demonstrates the relation of the average fitness of the
population for the test with complexity as part of the fitness
measure and the test without complexity as part of the fitness
measure. This test shows the advantage of evaluating the fitness
of an individual without using the complexity of the tree as a
factor. While the evaluation that used complexity had an edge
for a while (roughly generations 20-70), that method continued to
level off; the test without complexity began making a sharp
improvement around the 50th generation that continued for the duration
of the test (although it appears to level off near the end of the test),
indicating a strong ability to continue evolving a fitter population.
Furthermore, the variety results,
and my own examination, indicate that this was due to the difference
in the composition of the populations. The test with complexity was
eventually restricted to a group of similar trees, drawn from the set
of trees with a low complexity, while the test that was not restricted
by complexity had a very diverse population that was restricted only
by the constraints on the test itself (in this case, a maximum
complexity of 100). I believe that most variations in later generations
of the test with complexity are due more to the varying performance of
the random opponents, rather than any kind of "learning" process.
William Bauder
wjb14@columbia.edu