YRank
About YRank
During the last decade, there has been increased interest in the learning of ranking models, probably because of the wide range of its potential applications. However,one drawback of this learning task when used in some real world applications is the lack of interpretability of its results. Indeed, with most commonly used ranking methods (e.g. SVMs, Boosting) no explanations are provided to the user along with the ranking list.
In that context, we have developed YRank, a new method for providing explanations of the top part of a ranking list. The underlying idea is to produce interpretable rules by learning the main characteristic properties of the Top as opposed to the Bottom part of the ranking list. Such intelligible rules can be quite useful for the domain expert to direct actions and gain more understanding of the target system.
Notice that the former name of YRank is YSVM, as it has been developed initially to cope with SVM's lack of intelligibility. We have renamed it since it is actually independent from the ranking method used. You can provide any ranked list which does not have to be produced by SVMs.
To run YRank, you need to provide the system with a ranked list of examples described by categorical and numerical attributes. For numerical attributes, you can precise the method of discretization you want. Two discretization methods are possible with YRank: equisize or expert. For the equisize, you give the size of bins while for expert you need to provide the cutting points. Discretization need to be given for each numerical attribute in a separate file.
This distribution contains two scripts: feature_rankings.py and iterate_feature_rankings.py
feature_rankings.py
Usage: feature_rankings.py [options] [<]filename

Options:
  -h, --help            show this help message and exit
  -b BOTTOM_PRECENTAGE, --bottom-precentage=BOTTOM_PRECENTAGE
                        percentage of input to be considered "bottom"
  -t TOP_PRECENTAGE, --top-precentage=TOP_PRECENTAGE
                        percentage of input to be considered "top"
  -s SUPPORT_THRESHOLD, --support-threshold=SUPPORT_THRESHOLD
                        minimum percentage for support threshold
  -l LEVERAGE_THRESHOLD, --leverage-threshold=LEVERAGE_THRESHOLD
                        minimum leverage threshold between 0 and 0.25
  -p FIELD_SEPARATOR, --field-separator=FIELD_SEPARATOR
                        field separator
  -m MAX_FEATURES, --max-features=MAX_FEATURES
                        Maximum number of features to combine
  -a NUMERICAL_ATTRIBUTES, --numerical-attributes=NUMERICAL_ATTRIBUTES
                        Filename which contains specs for discretization
  -c COPY_MODIFIED_INPUT, --copy-modified-input=COPY_MODIFIED_INPUT
                        Filename to which to write a copy of discretized input
  -g, --graph           Output histograms
  -q, --quiet           suppress certain error messages
iterate_feature_rankings.py
Usage: iterate_feature_rankings.py infile from_value to_value step [--extra-args=...]

Options:
  -h, --help            show this help message and exit
  --extra-args=EXTRA_ARGS
                        extra arguments to pass to feature_rankings.py
Examples
Here is a complete toy example:
toy.txt
--------
Rank Size Manufacturer Age
1 500 B 2
2 500 B 8
3 1000 C 12
4 500 A 1
5 500 B 17
6 500 A 27
7 2000 A 2
8 2000 A 8
9 2000 A 12
10 2500 B 25
toy.att
--------
Size equisize 500
Age expert 3,10,15,25
python feature_rankings.py -q -b 50 -t 50 -s 0.0001 -l 0.1 -m 2 toy -a toy.att
num bottom =5
num top =5
final num records =10
Total number of features = 7
Average leverage = 0.135714285714
Standard deviation of leverage = 0.0225876975726
Number of top features = 3
Average leverage for top features = 0.133333333333
Standard deviation of leverage for top features = 0.0235702260396
Number of bottom features = 4
Average leverage for bottom features = 0.1375
Standard deviation of leverage for bottom features = 0.0216506350946
PropertiesAll.txt
------------------
feature Freq_top sup_top lev_top Freq_bottom sup_bottom lev_bottom
--------------------------------------------------------------------------------
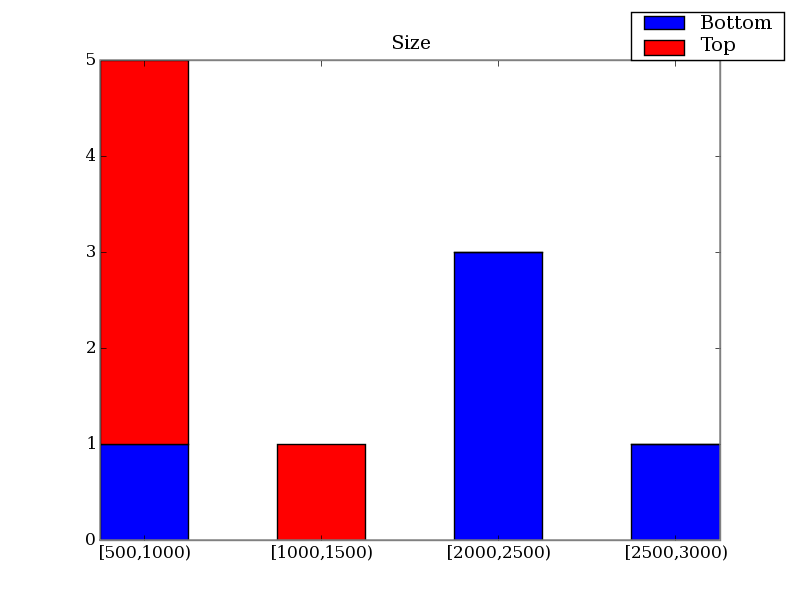
Size=[2000,2500) 0 0 -0.15 3 0.30 0.15
Size=[500,1000) 4 0.40 0.15 1 0.10 -0.15
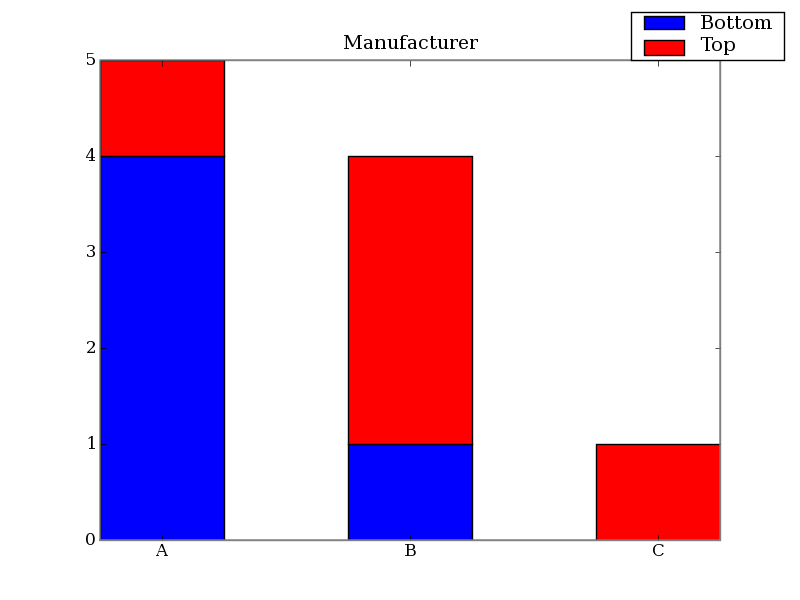
Manufacturer=A 1 0.10 -0.15 4 0.40 0.15
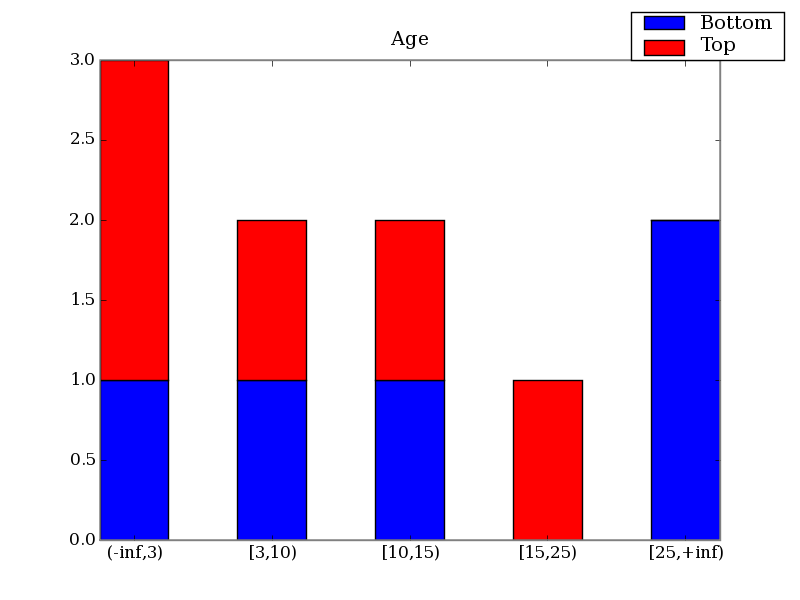
Age=[25,+inf) 0 0 -0.10 2 0.20 0.10
Manufacturer=A
AND Size=[2000,2500) 0 0 -0.15 3 0.30 0.15
Manufacturer=B
AND Size=[500,1000) 3 0.30 0.15 0 0 -0.15
Age=(-inf,3)
AND Size=[500,1000) 2 0.20 0.10 0 0 -0.10
PropertiesBottom.txt
---------------------
feature freq support leverage
--------------------------------------------------------------------------------
Size=[2000,2500) 3 0.30 0.15
manufacturer=A 4 0.40 0.15
Age=[25,+inf) 2 0.20 0.10
Manufacturer=A AND Size=[2000,2500) 3 0.30 0.15
PropertiesTop.txt
------------------
feature freq support leverage
--------------------------------------------------------------------------------
Size=[500,1000) 4 0.40 0.15
Manufacturer=B AND Size=[500,1000) 3 0.30 0.15
Age=(-inf,3) AND Size=[500,1000) 2 0.20 0.10
Histograms
----------
size.png
Manufacturer.png
Age.png